Simulations of the tsunami on Samoa
NGI and ICG (International Centre for Geohazards) have made numerical simulations of the generation and propagation of the tsunami which hit the Pacific islands of Samoa and American Samoa on Wednesday morning Norwegian time.
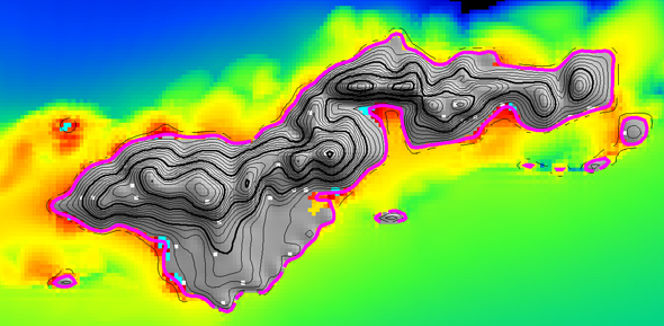
The numerical simulations are based on generally available data on the earthquake in the Western Pacific and the topography in the affected area. The analysis is done by NGI's tsunami group and Professor Geir Pedersen at the University of Oslo (UiO).
The reported magnitude of the earthquake southwest of Samoa islands ranges between Mw 8-8.3 on the Richter scale. Our earthquake sources are based on the combination of publicly available magnitude estimates, as well as seismic wave inversion by Yagi, and have a moment magnitude of Mw 8.1.
Information on sea bottom topography is provided by "General Bathymetric Charts of the Oceans". Data describing seabed movements and topography are used as input parameters for analysis of tsunami propagation by using the GloBouss model, developed by NGI/ICG/UIO.
The results of the analyses of the tsunami hitting the islands of American Samoa and Samoa and the northern islands of Tonga can be seen in the enclosed animations (wmv-files up to the right on this page). In addition, the run-up of the waves when the tsunami hits the islands was also simulated by the NOAA's ComMIT model. NOAA Center for Tsunami Research has created theme sites for the Samoa Event.
Two potential scenarios
The preliminary investigations are based on two potential scenarios both with a magnitude of Mw8.1. Below the sea surface deformation spontaneously after the release of the earthquake, maximal surface elevations and run-up heights for the islands Tutuila (American Samoa) and Upolu (Samoa).
Deformation of sea surface spontaneously after the earthquake south of Samoa:
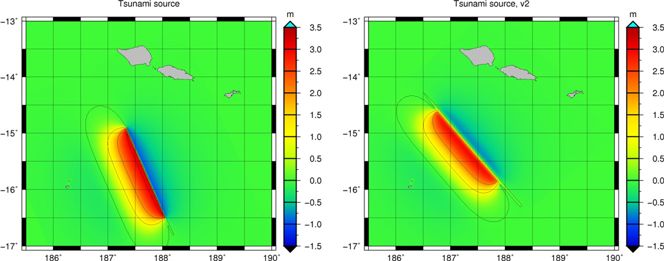
Scenario "v1" facing eastward (left) and Scenario "v2"facing Samoa (right)
Maximum heights at American Samoa (Tutuila)
The calculation of the maximum surface elevations and run-up heights for American Samoa (Tutuila) are shown here. The preliminary results show that v1 and v2 give 2-10+ and 1-7 meters, respectively, taking the whole island into account. At the town, of Pago Pago, the run-up for these scenarios is found to be 10 and 5-8 meters.
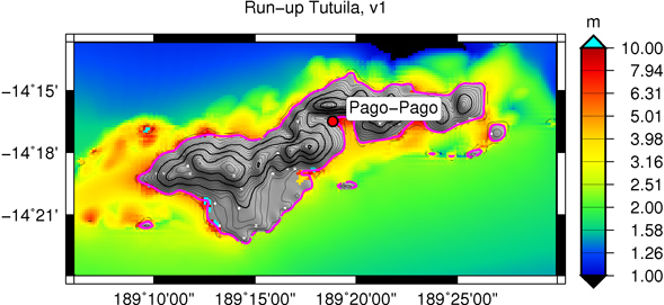
Scenario "v1" at American Samoa (Tutuila) give 2-10+ metre run-up
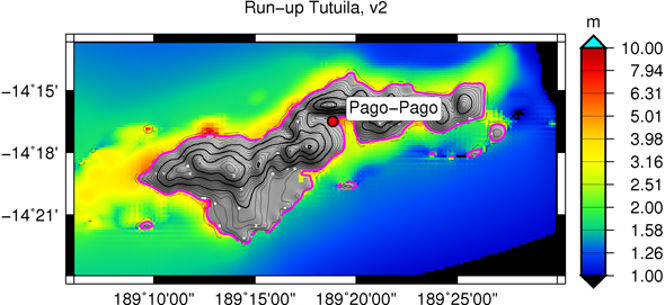
Scenario "v2" at American Samoa (Tutuila) give 1-7 metre run-up
Maximum heights at Samoa (Upolu)
The calculation of the maximum surface elevations and run-up heights for Samoa (Upolu) are shown here. The preliminary results show that v1 and v2 give 0.5-3 and 1-10 meters, respectively, taking the whole island into account. At the town, of Apia, the run-up for the scenarios is found to be 0,5 and 0,8 meters, respectively.
Compared with the tsunami recordings, scenario v2 describes the tsunami most closely. The bathymetry and topography are based on GEBCO 0.5 min (a resolution of about 900 meters).
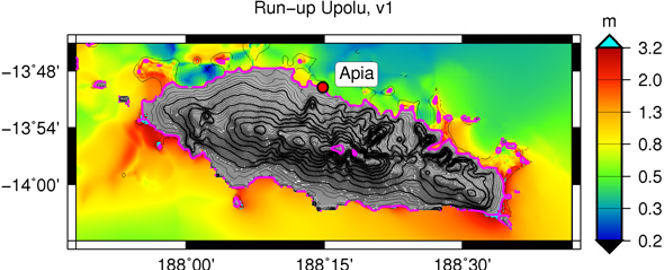
Scenario "v1" at Samoa (Upolu) give 0.5-3 metre
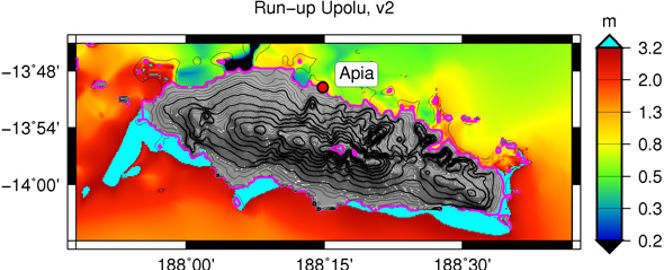
Scenario "v2" at Samoa (Upolu) give 1-10 metre
The computational grid for the run-up calculations is resampled down to a resolution of 200 meters. The calculations are therefore only valid as an overview over the run-up distribution since local effects are not captured in the coarse bathymetry.
The published registrations (e.g. NOAA and UNESCO/IOC) show wave heights at Apia to be 0.7 meters, while 1.57 and 3.5 meters at Pago Pago. However, the gauges are often localized close to the shore in shallow water, giving possible large local effects not captured in the numerical model.
You can read more about NGI's expertise on tsunamis.


Sylfest Glimsdal
Senior Specialist Climate Adaptation and Hydrodynamics sylfest.glimsdal@ngi.no+47 909 72 669