Vulnerability
Within the preparation of HAZUS, FEMA developed capacity curves for 36 building types (representative of the United States) in four earthquake load regimes (reflecting the variation in building regulations as a function of time across the United States).
These 144 capacity curves were analytically developed but are adjusted so that empirical knowledge is incorporated into the curves whenever possible.
The building capacity curve is described by three control points representing design, yield, and ultimate capacity. Up to the yield point, the building's capacity curve is assumed to behave linearly (ideal elastic). From the yield point to the ultimate point, the capacity curve changes from a perfect elastic to a fully plastic state (curved form), and the curve is assumed to remain fully plastic past the ultimate point (linear form).
A bilinear representation (two linear parts) sometimes simplifies the model. The vulnerability curves (fragility curves) are developed as lognormal probability distributions of damage from the capacity curves.

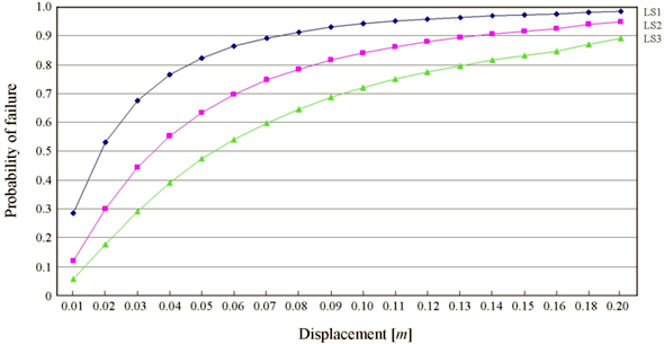
Figure 6. Fragility curves for 902 reinforced-concrete buildings (1- to 3-story) in Oslo for Damage Limit States 1, 2, and 3 using a displacement-based approach.
Using inventory data from Oslo (Norway) with 902 reinforced-concrete (RC) buildings from the district Grünerløkka, a simple classification of the buildings yields fragility curves as shown in Figure 6, for Damage Limit States 1 to 3 (1: no damage, 2: slight damage, and 3: moderate damage).