Soil amplification studies
This work includes: • Numerical simulation of H/V-data • Instrumental soil response studies
Numerical simulation of H/V-data
The work uses NGI's Green functions software Laysac to simulate the steady-state horizontal and vertical motions on the ground surface due to a distant source.
The objective is then to use the simulated data to assess the H/V method's performance/validity and range of applicability of the H/V method for different soil profiles, especially for a range of stiffness contrast at the rock/soil interface. The results will also be compared with the associated transfer functions for the selected soil profiles.
Instrumental soil response studies
As already mentioned, the amplification of seismic waves as they propagate through less consolidated sediments and soils is a significant factor behind earthquake damage. The thick clay deposits in and around Oslo lend this region to such studies. Although Oslo is not a place with significant seismic activity, a few earthquakes with noticeable intensity have occurred, including a magnitude 5.4 earthquake in the outer Oslofjord in 1904.
This earthquake caused masonry building walls to crack and chimneys and roof tiles to fall off the houses in Oslo. The observed significant shaking (and the associated damages) was caused by wave amplification through the thick layers of sediments underlying Oslo.
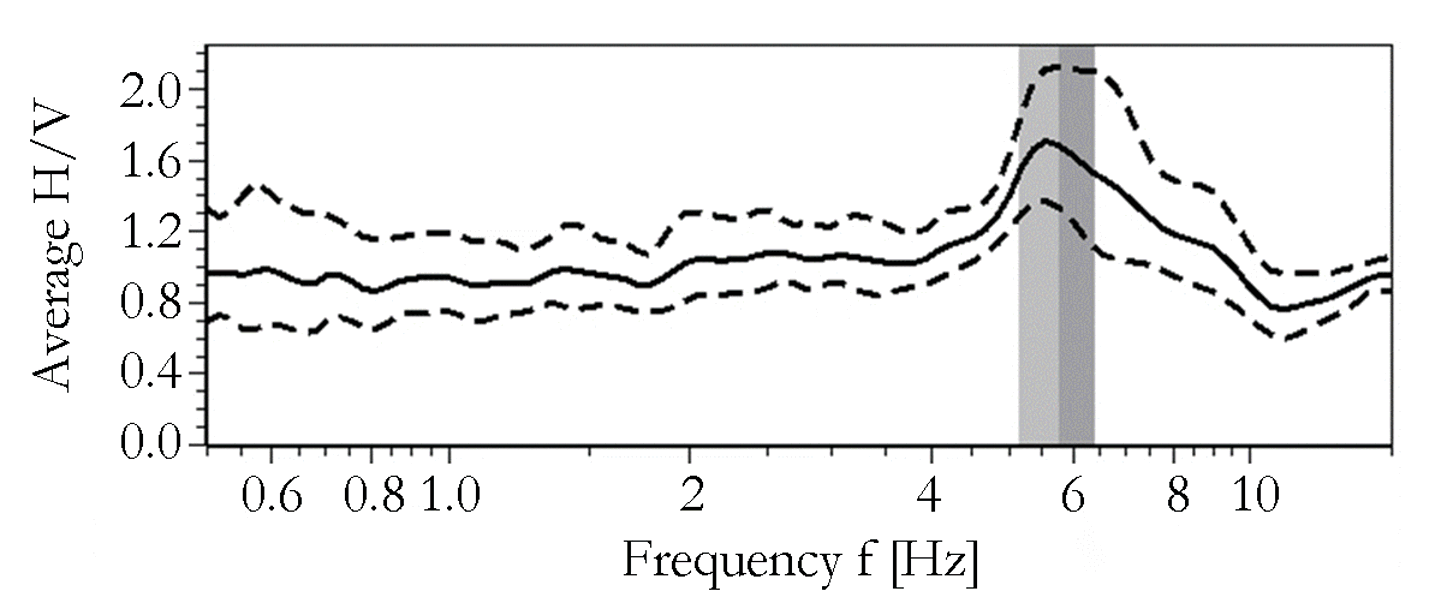
To investigate this phenomenon in more detail, we conducted special studies in 2004 and 2006, visiting 35 different sites within the city. The technique insisted on recording ambient seismic noise and inferring the soil response based on such data using the Nakamura technique, based on ambient noise H/V (horizontal-to-vertical) ratios. The results (Figure 12) mainly explain the distribution of damages from the 1904 earthquake.

Figure 12. Spectral H/V ratio (median and the range of ± standard deviation) of site no. 28 (Oslo study). The peak at around 6 Hz indicates the first resonant frequency of the soil profile.
The simple Nakamura technique presented above is complemented by more elaborate methods, which have also been tested and used under ICG SP 3, notably an array technique and a technique based on spectral analysis of surface waves (SASW). The former technique has been used in a conceptual study at Sogn Hagekoloni in Oslo, using two different array diameters.
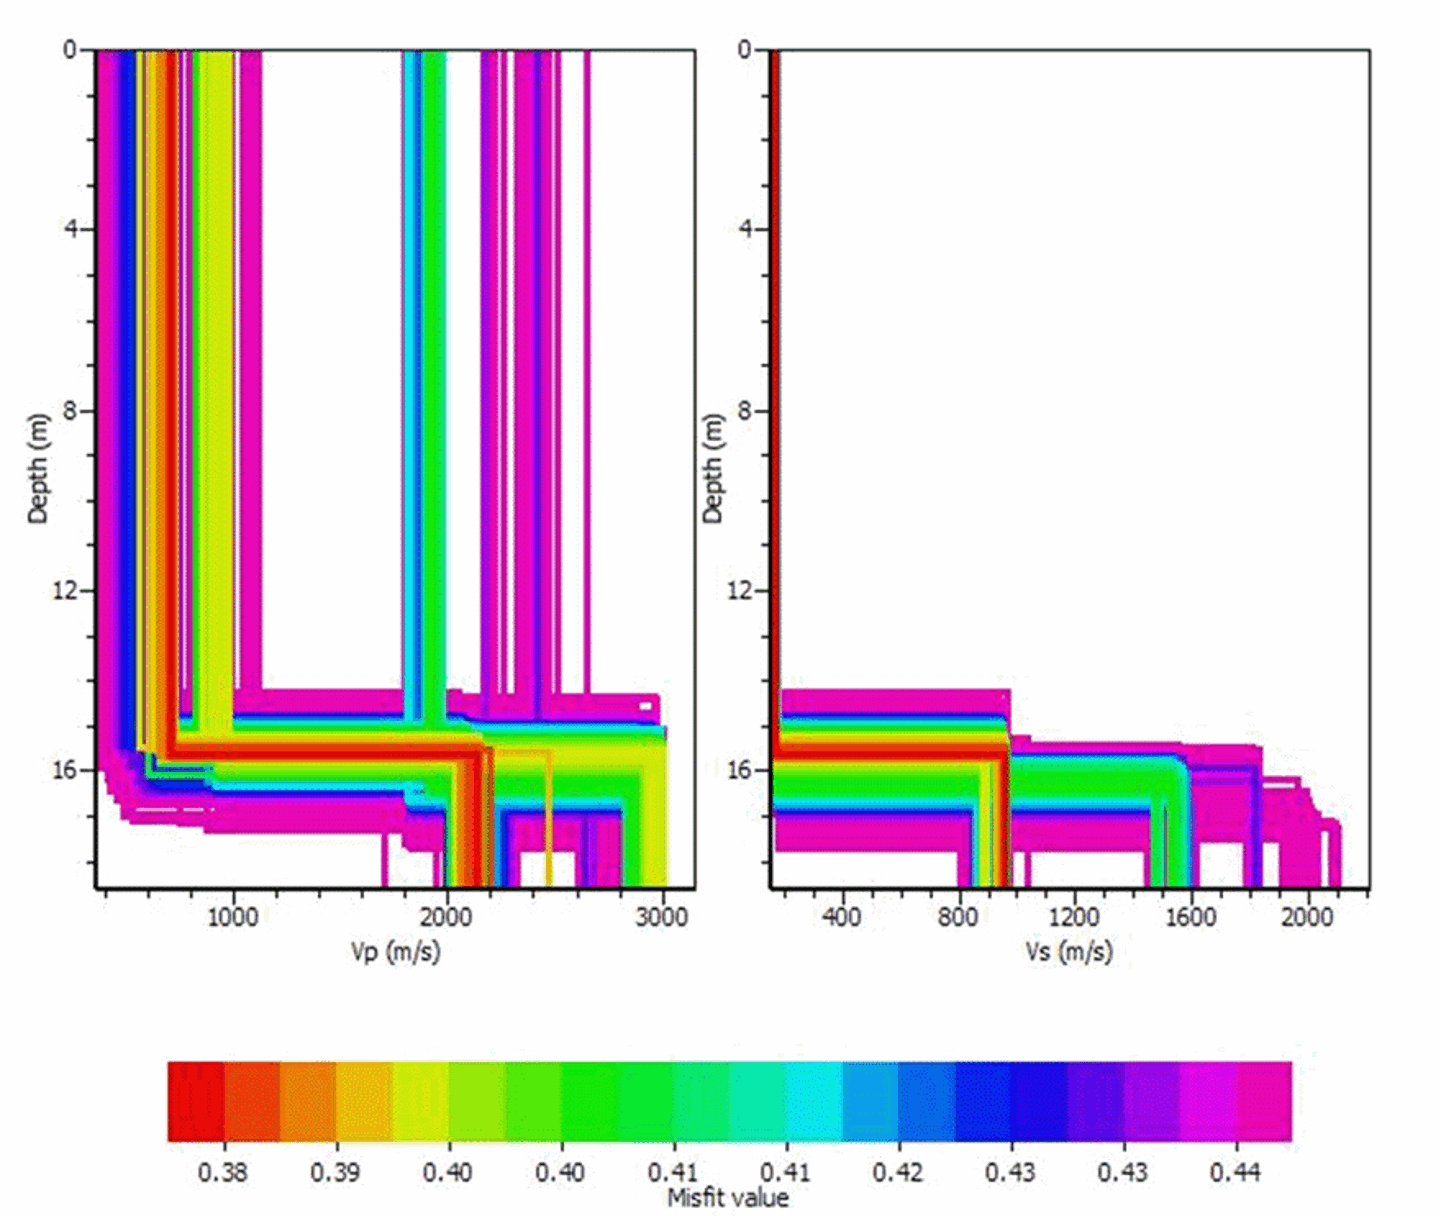
The data regarding H/V ratios on individual stations have been analyzed, and a subsurface shear-wave velocity profile was established through joint analysis of the two array geometries (Figure 13).

Figure 13. Ambient seismic noise recorded by two arrays with different aperture in order to conduct non-unique forward modelling of the velocity profile that matches the observed dispersion curves.