Dissemination on risk assessment
Two seminars have been held: • Vulnerability and risk seminar November 2005 • Åknes Risk workshop October 2007
Vulnerability and risk seminar November 2005
On the 17th of November 2005, a seminar on risk and vulnerability analysis was arranged at NGI. The speakers and participants sought to represent the different steps in risk analysis, see Figure 1.
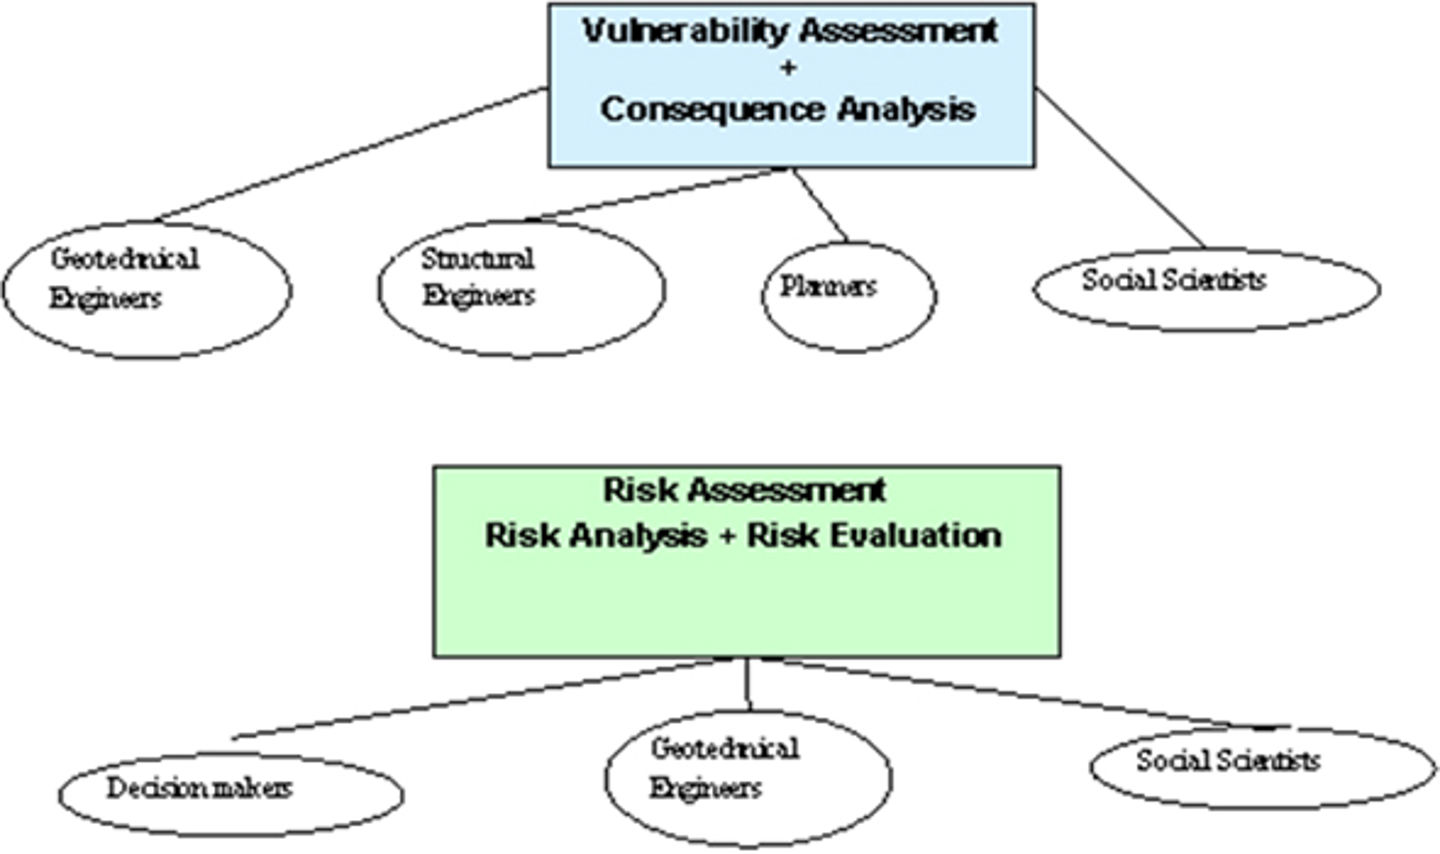
Figure 1: Stakeholder in risk assessment steps
The aims of the seminar were to:
- form an arena where specialists, authorities, engineers, and researchers can openly exchange experience and ideas about risk assessment
- get to know each other - needs and problems
- increase the understanding of vulnerability and risk analyses
The seminar consisted of five main parts:
- scope of analysis
- hazard assessment
- vulnerability assessment and consequence analysis
- risk estimation
- risk assessment and mitigation
There were speakers from ICG (NGI and NORSAR), the Directorate for Civil Protection and Emergency Planning, the County Governor of Sør Trøndelag, the County geologist of Møre and Romsdal, National Office of Building Technology and Administration, Scandpower, Standards Norway, Middle East Technical University and Norwegian Water Resources and Energy Directorate
Below you will find ppt.-presentations in the different parts of the seminar.
Part I: Scope of risk analysis
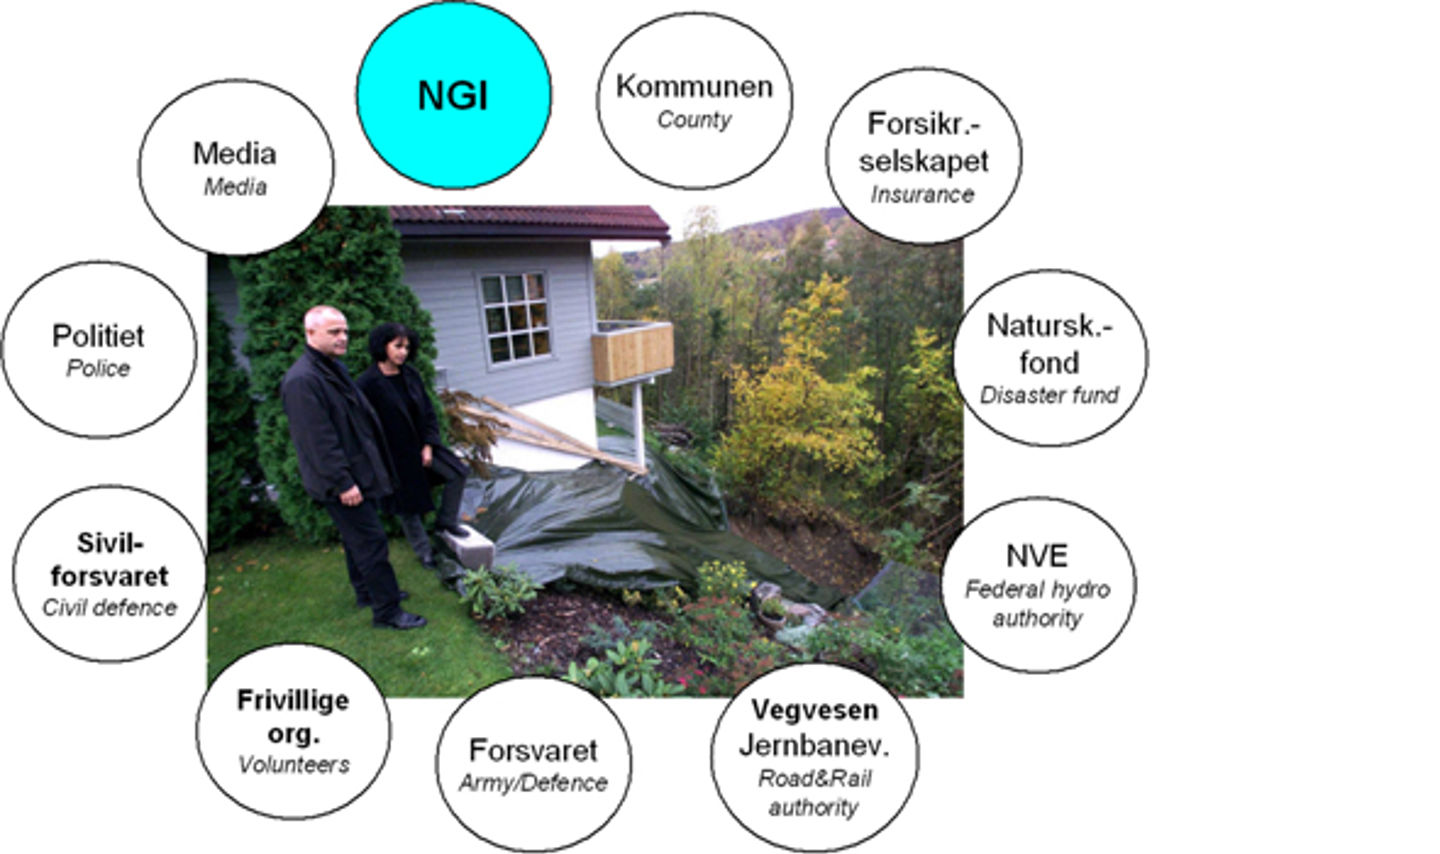
Figure 2: Example that several actors are involved in landslide risk management
- Introduction, by Suzanne Lacasse (NGI)
- Risk terminology, by Unni Eidsvig (NGI)
- Risk and vulnerability analyses, by Nils Ivar Larsen (DSB)
- Expectations from the County governor, by Svein Horn Buaas
- Mountain slides and tsunamis in Møre og Romsdal, by Einar Anda (County geologist)
- Risk acceptance, by Kari-Anne Pape Simenstad (BE)
Part II: Hazard assessment
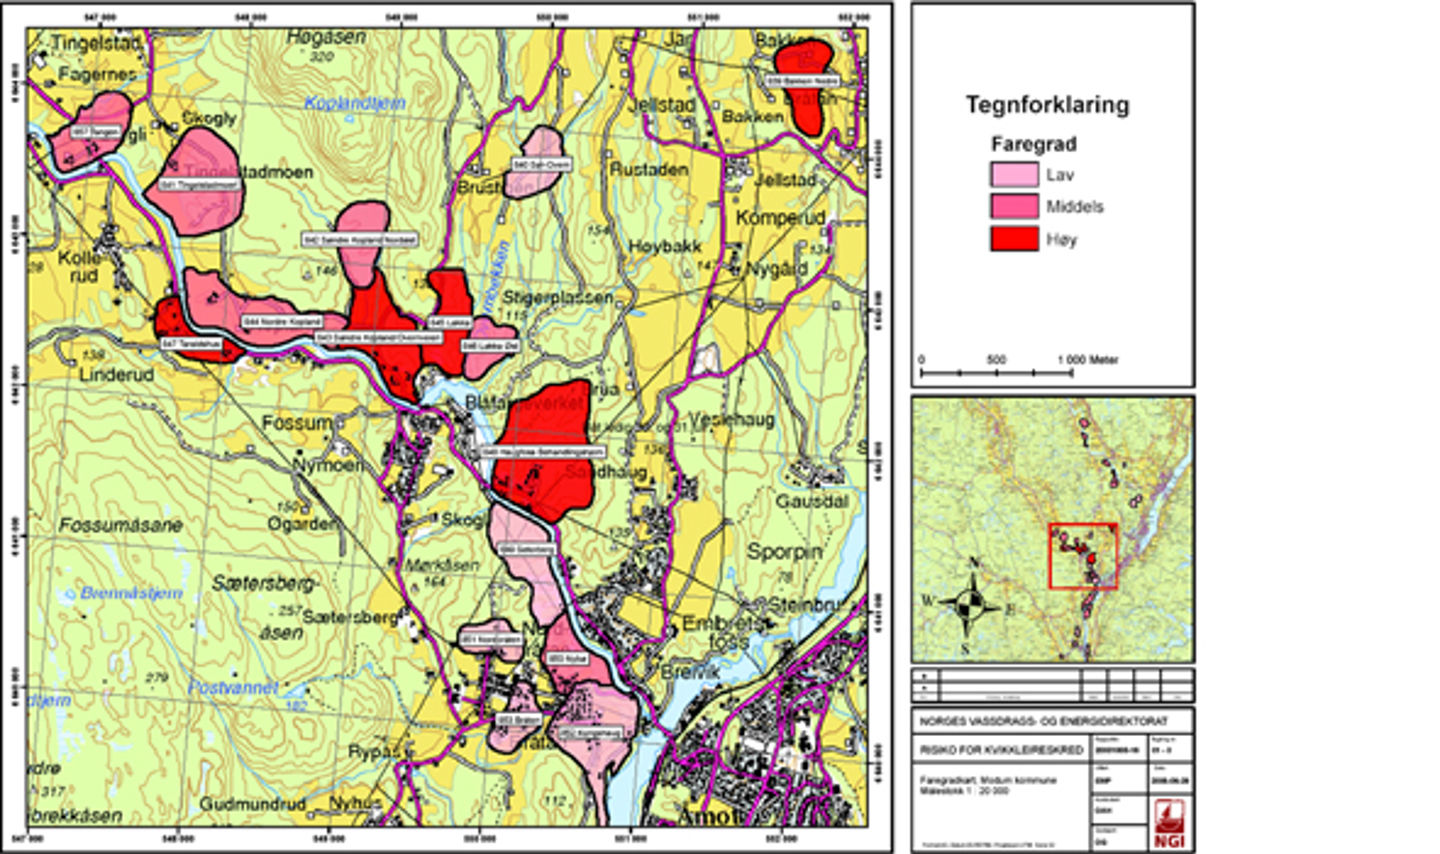
Figure 3: Qualitative hazard map
- Quick clay risk, by Odd Gregersen (NGI)
- Landslide hazard, by Karstein Lied (NGI)
- Hotspots, by Farrokh Nadim (NGI)
Part III: Vulnerability assessment and consequence analysis
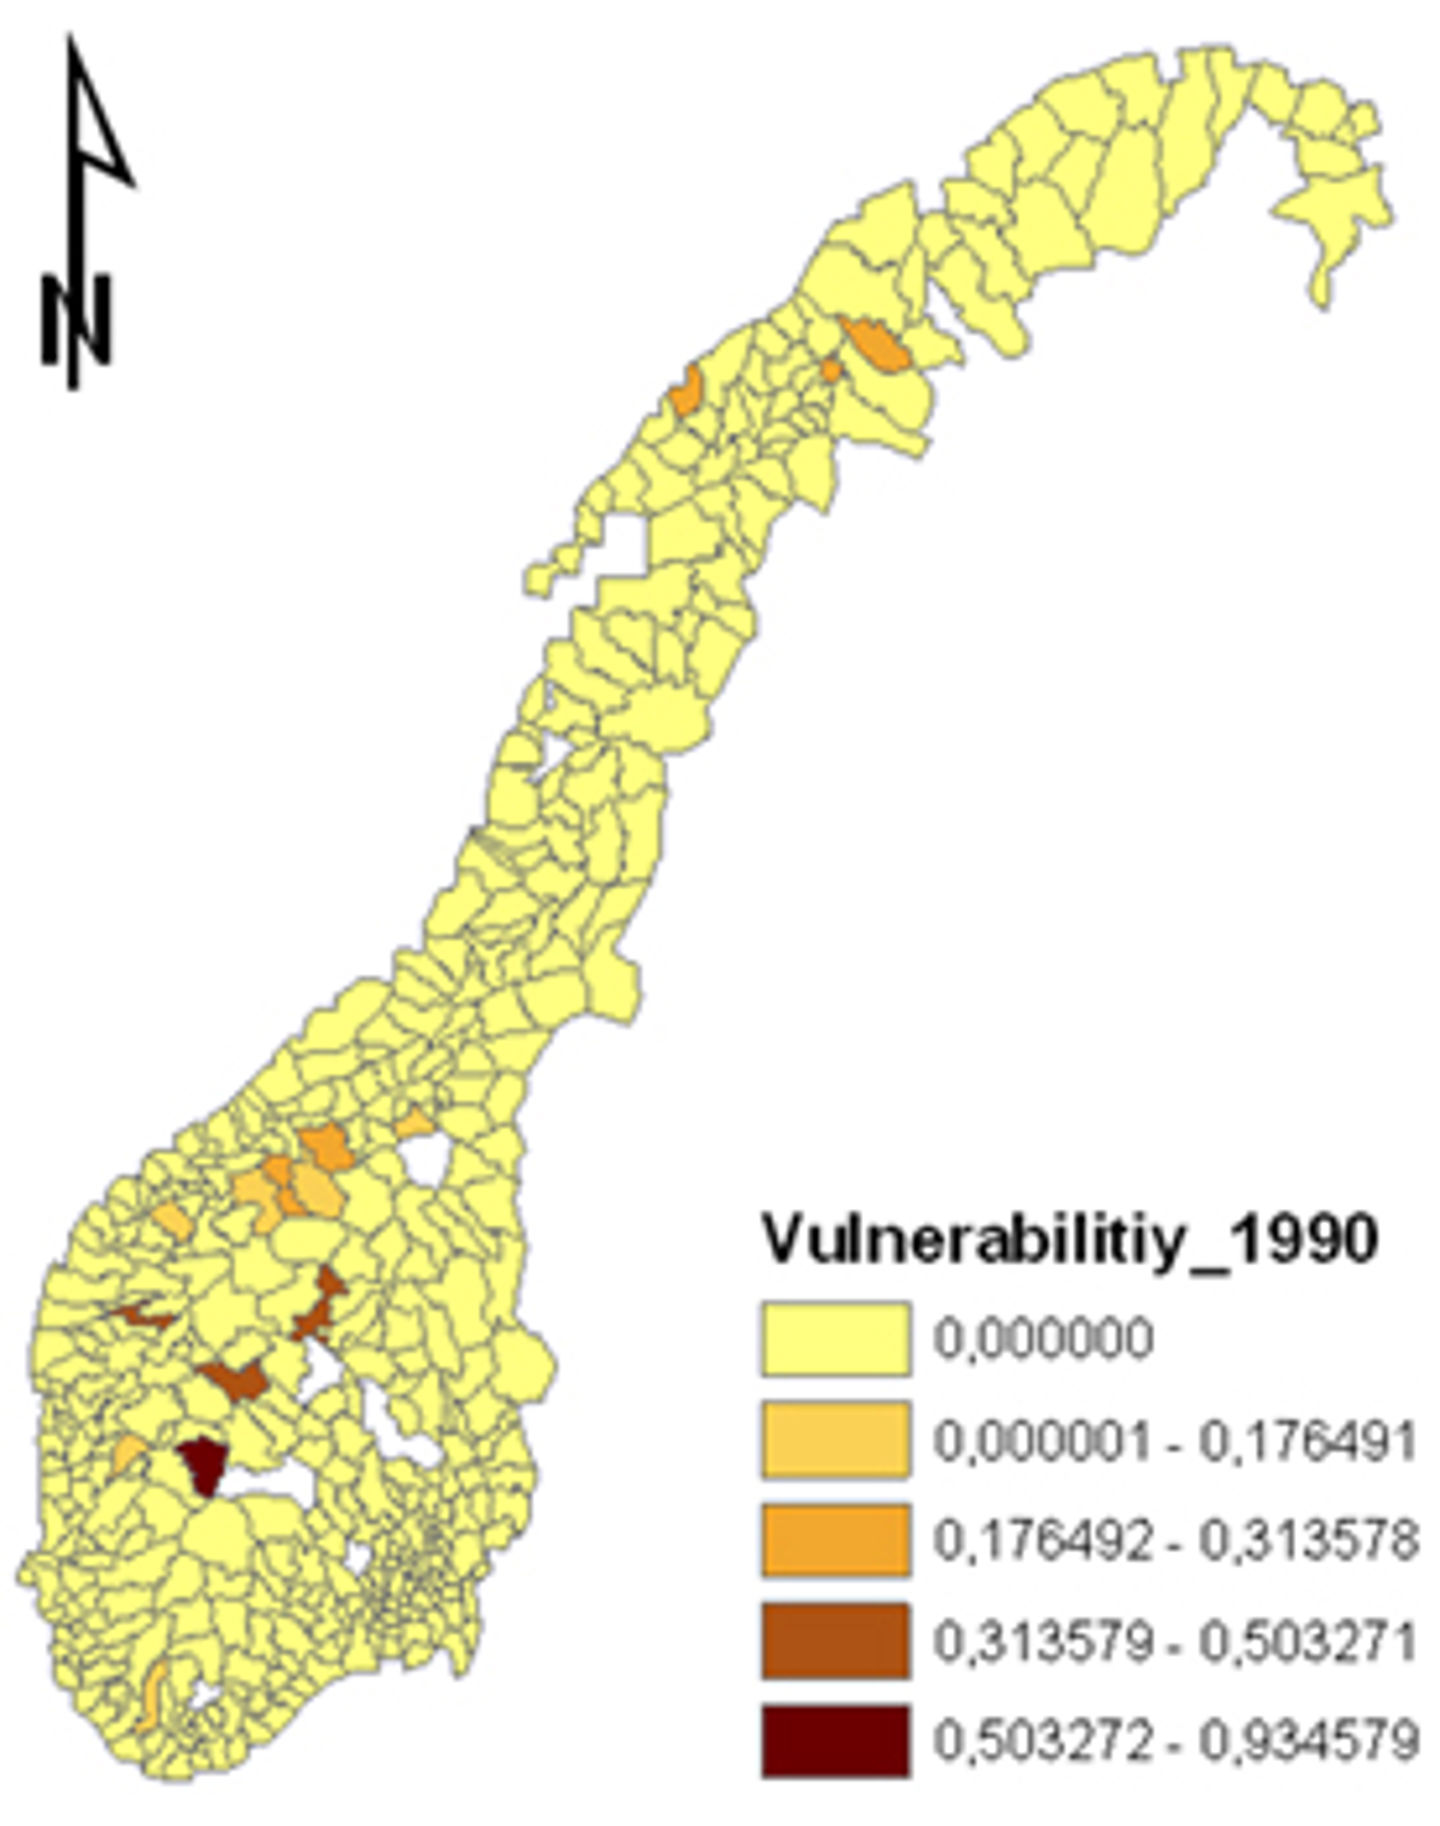
Figure 4: Population vulnerability for 1980-1990
- Some highlights from landslide risk management conference in Vancouver, by Unni Eidsvig
- Vulnerability in relation to risk management, by Sebnem Düzgün (Middle East Technical University)
Part IV: Risk estimation
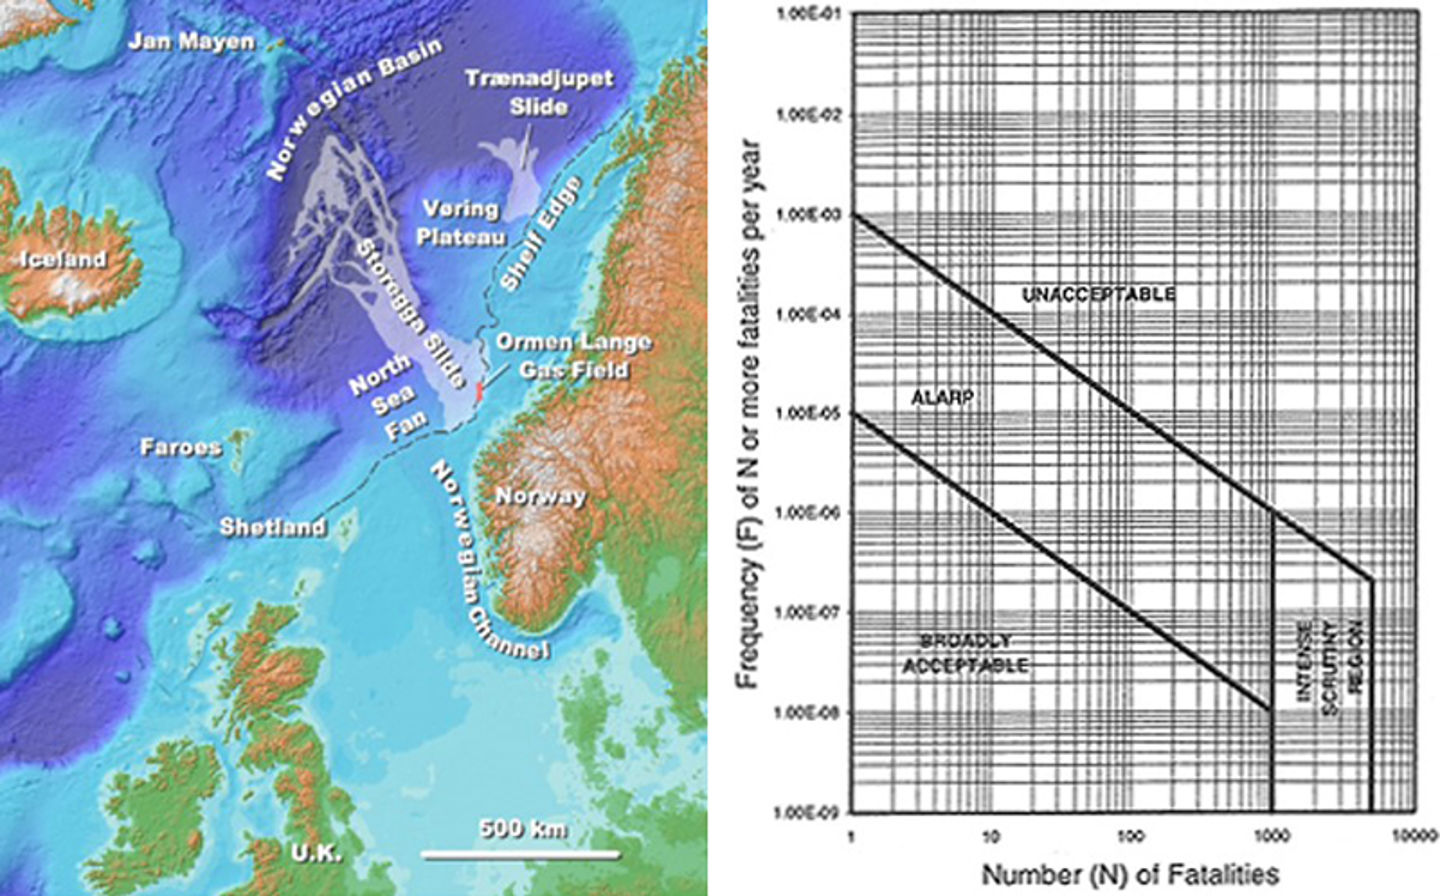
Figure 5 (left): Localisation of the Ormen Lange Gas Field, and Figure 6 (right): Risk acceptability
- Risk estimation for Ormen Lange, by Jan Lund (Scandpower)
Part V: Risk assessment and mitigation
- f-N curves, social aspects, and risk acceptability, by Sebnem Düzgün
- Mitigation against natural disasters, by Steinar Schanche (NVE)
- Environmental risk, by Gijs Breedveld (NGI)
Åknes Risk workshop October 2007
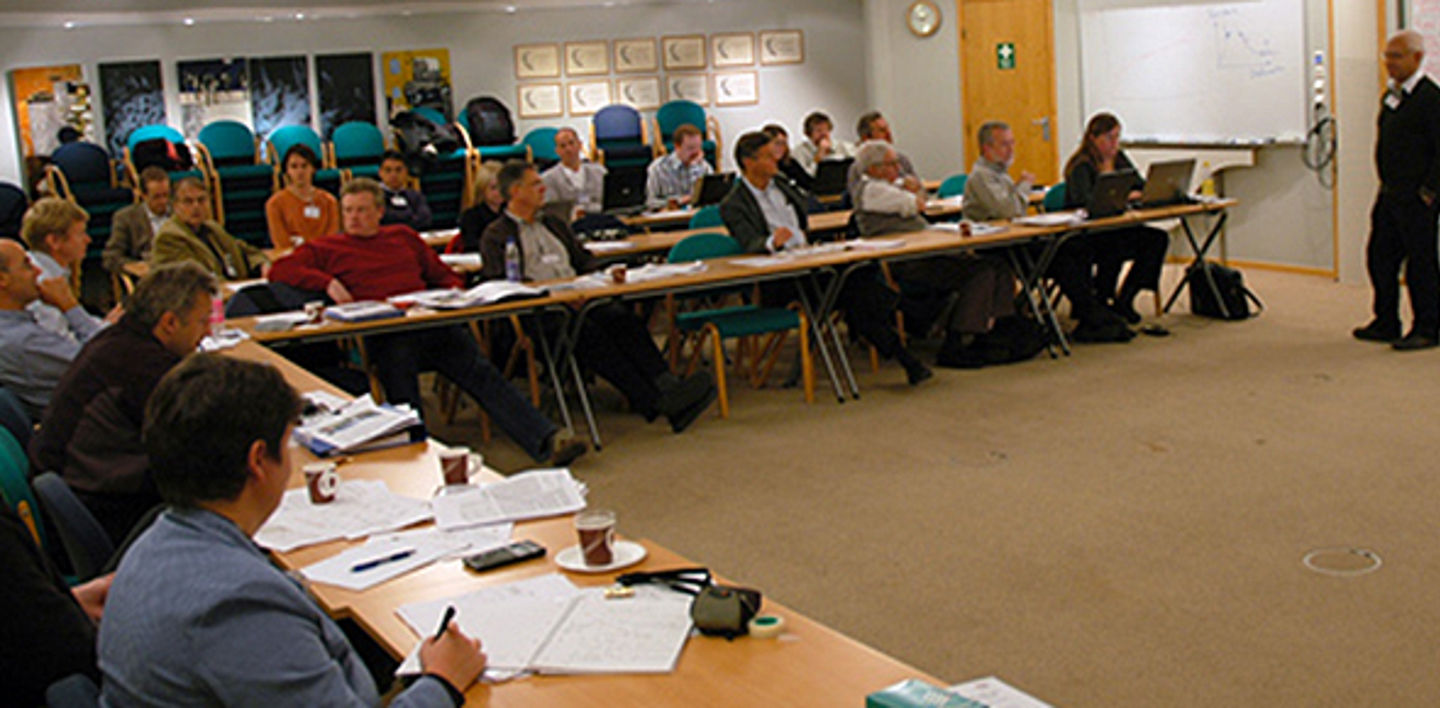
Figure 1 A workshop was held at NGI October to discuss and assess the risk associated with the Åknes rock slope.
Åknes is a rock slope over a fjord arm on the west coast of Norway. The area is characterized by frequent rock slides between 0.5 and 5 million m3 volumes. Massive slides have occurred in the region, e.g., the Loen and Tafjord disasters. Bathymetric surveys of the fjord bottom deposits show that numerous gigantic rockslides occurred thousands of years ago.
The Åknes/Tafjord Project includes site investigations, monitoring, and an early warning system for the potentially unstable rock slopes at Åknes in Stranda County and Hegguraksla in Norddal County. The project also includes a regional susceptibility and hazard analysis for the inner Storfjord region, which provides for Tafjord, Norddalsfjord, Sunnylvsfjord, and Geirangerfjord.
The potential disaster associated with a rockslide and tsunami involves many parties with differing opinions and perceptions. As part of the ongoing hazard and risk assessment and validation of the early warning system, event trees were prepared by pooling the opinion of engineers, scientists, and stakeholders. The objective was to
- bring all stakeholders into the discussion of hazards and risks at Åknes
- reach a consensus on the danger and risk associated with a rockslide triggered-tsunami
- discuss and evaluate mitigation measures
- experiment with ETA as a communication tool
The following event trees were constructed during the three-day meeting:
- rockslide due to seismic trigger
- rockslide due to high pore pressure trigger
- rockslide due to weathering and creep trigger
- tsunami wave against Hellesylt
- consequences of tsunami
- optimum observations for early warning
The participant list for the results shown below included the following representatives:
- manager for Åknes/Tafjord project
- mayor of a community
- social scientists from the community
- city planner from the community
- policeman working on emergency plans and evacuation
- local politician
- representative from the community office
- Directorate for Safety and emergency preparedness
- journalist/media
- officer from the Ministry of highways
- meteorologist
- physical geographer
- social geographer
- geologist
- engineering geologist
- rock mechanics specialist
- geotechnical engineer
- tsunami specialist
- instrumentation specialist
- earthquake engineer
- seismologist
- mathematician
- statistician
- risk analysis specialist
Rockslide Triggered by Earthquake
For simplicity, the steps for the event tree in Figure 8 (seismic trigger) are only shown for an earthquake magnitude of 6. Earthquake magnitude (M) of 4 and M between 4 and 6 are treated similarly to magnitude 6, but the probability estimates differ.
The steps for the event tree in Figure 8 include the following:
- earthquake occurs
- magnitude of the earthquake (M = 4 to 6)
- distance from earthquake epicenter to rockslide scarp (D=less or greater than 50 km)
- earthquake acceleration (Amax < 0.1g to Amax > 0.25g)
- pore pressure (PP less or greater than normal)
- rockslide occurs co-seismically, i.e., at the same time or within 10 minutes of the earthquake, or the earthquake may lead to a degradation process leading to slope failure at a later stage (co-seismic, yes or no).
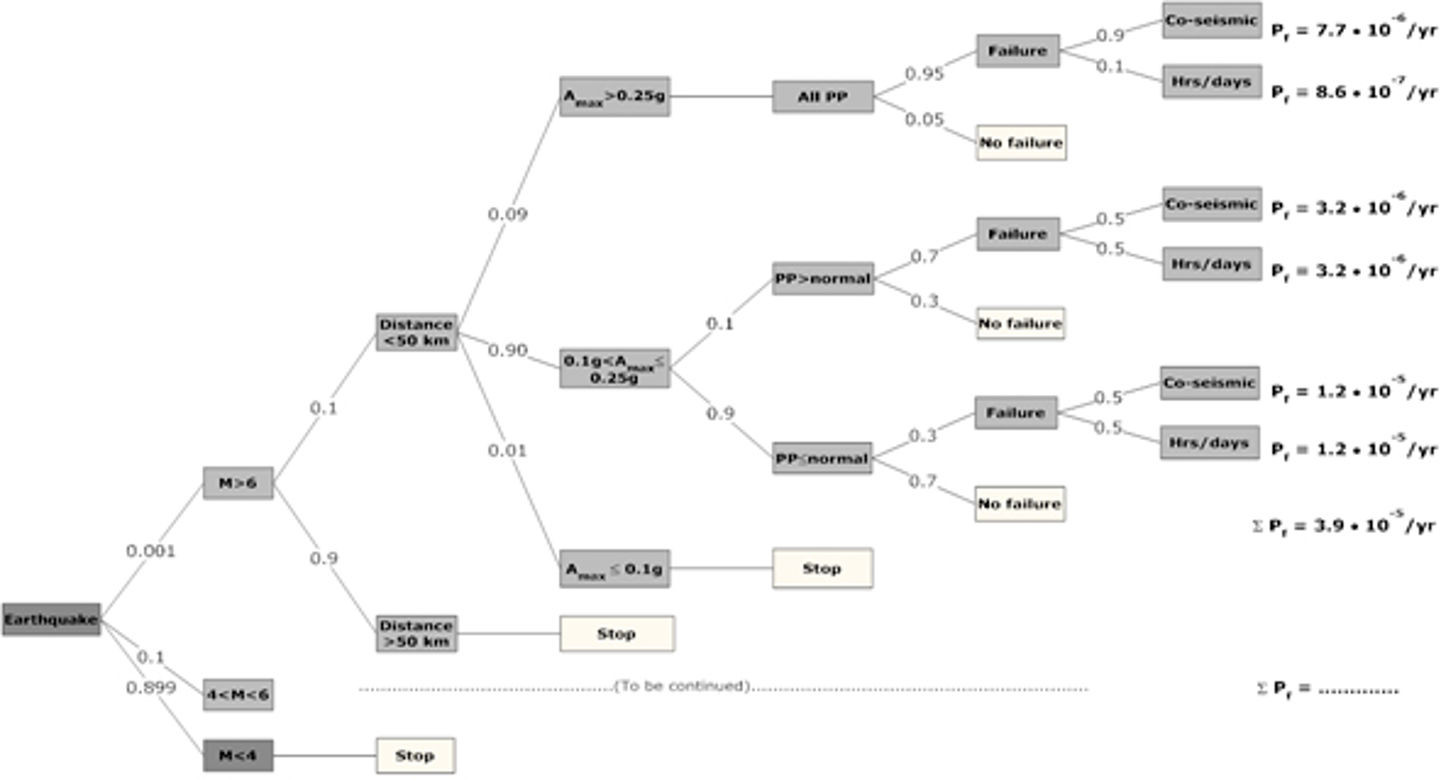
Figure 2 Event tree for earthquake triggered rockslide
The failure probability is the summation of the failure probabilities, Pf, in all tree branches. The aggregated annual failure probability for Magnitude 6 and more significant in the figure above is Pf = 4 x 10⁻⁵/yr. To find the total probability of an earthquake-triggered rockslide, the aggregated failure probability from the branch with a Magnitude between 4 and 6 needs to be added.
The event tree approach can quantify hazards and risks and indicate the most critical situations. The ETA approach is beneficial for geotechnical problems that involve significant uncertainties. The examples given for the Åknes/Tafjord project illustrated the method. One should refer to the Åknes/Tafjord Project for site-specific quantitative estimates.
The consensus process with a group of scientists from se­ve­ral fields of expertise, including the geoscientific, political, social, and public arenas, enabled the participants to quantify the probability of occurrence of a catastrophic rockslide and tsunami, examine the required parameters for adequate early warning and discuss possible mitigation measures. Work is still underway on these aspects of the analysis.
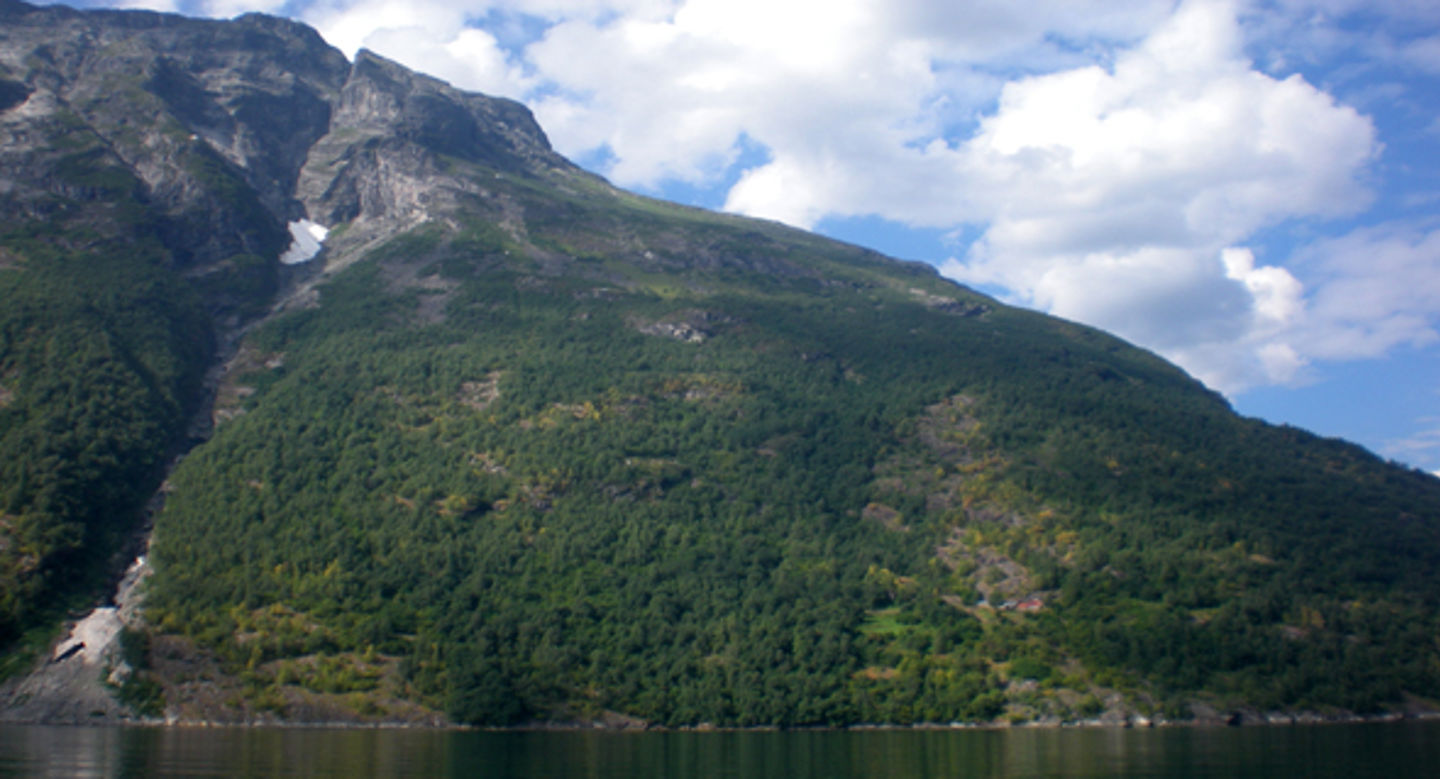
Figure 3 The Åknes rock slope
